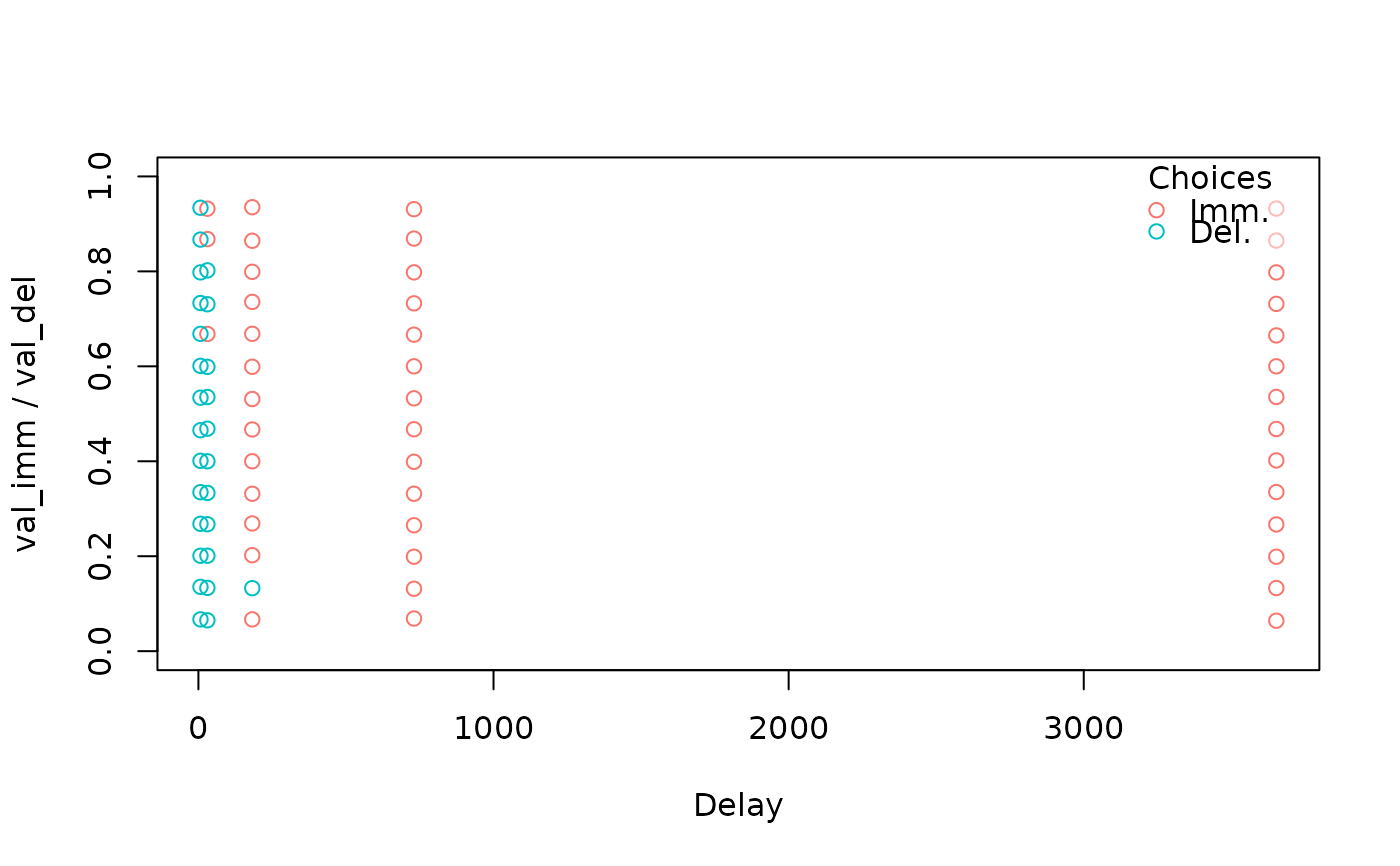
Create a plot that displays binary choices at each delay
Arguments
- data
A data frame with columns
val_immandval_delfor the values of the immediate and delayed rewards,delfor the delay, andimm_chosen(Boolean) for whether the immediate reward was chosen.- legend
Logical: display a legend?
- ...
Additional arguments to
plot().
Examples
# \donttest{
data('td_bc_single_ptpt')
plot_choices(td_bc_single_ptpt)

# }
# }